How Sound Works
For the most up-to-date "How Sound Works" Prezi presentation, follow this link: How Sound Works
Sound moves thru air by compressing and rarefying (lowering the ambient pressure) of air molecules. The waves move through air like it is a fluid, and it is the pressure waves moving, like waves in water when you throw a rock in a pool. So it is changes in air pressure that move, transmitting the sound.

Representing Sound
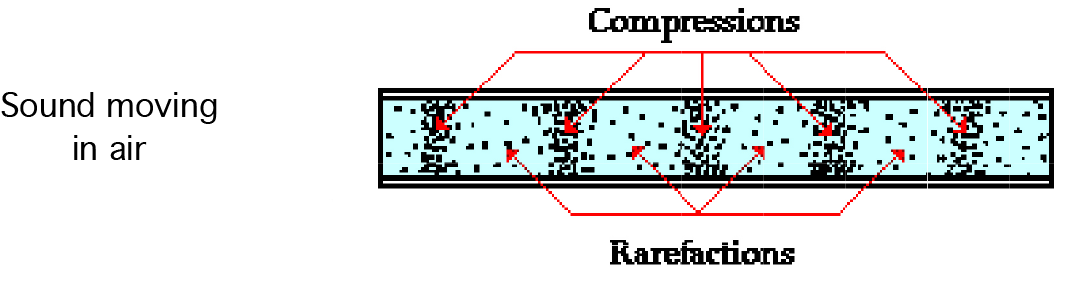
This image shows our molecules being compressed and rarefied in air. Time is the horizontal axis, and pressure is the vertical axis.
These pressure waves move at 1130 feet per second at sealevel at 70 degrees F. They have positive and negative periods, and are typically periodic, having some rate of the changes. Our ears perceive this as pitch, and we label this rate as frequency. Originally abbreviated as cps (cycles per second) we now use hertz (hz), in memory of Heinrich Hertz, a famous German scientist of the 1800s who worked with electromagnetic waves. http://en.wikipedia.org/wiki/Heinrich_Hertz
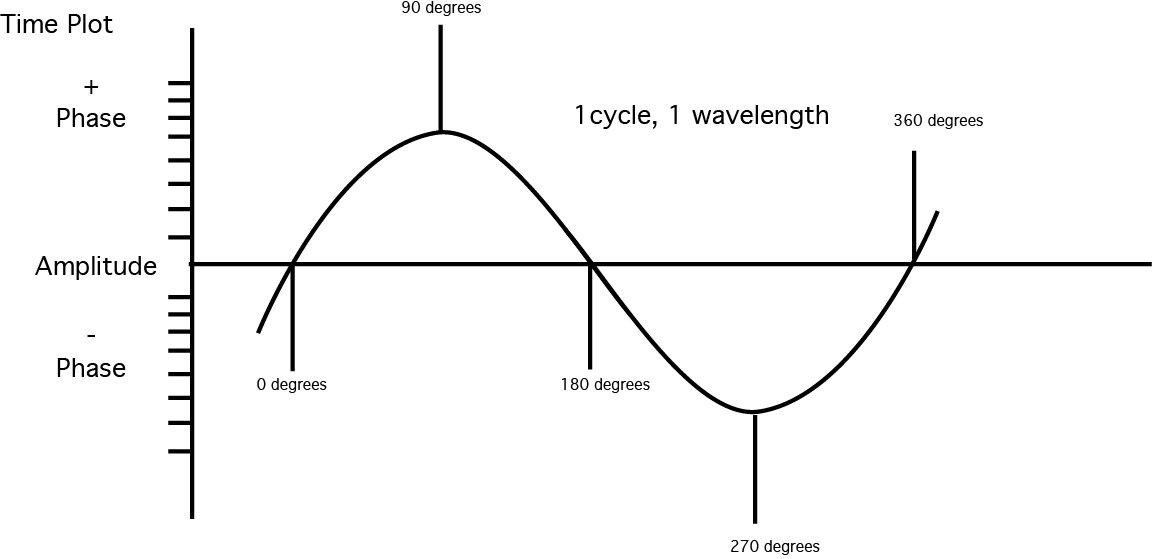
We draw graphs that show these pressure changes to represent the amplitude of the sound, and it's frequency. These same graphs can represent the electrical equivalent of the sound waves once they are converted by a microphone into a signal we can record.
This plot shows an amplitude over time graph of the changing pressure of the wave. The vertical axis could be pressure if we were looking at air, OR it can be voltage if we are looking at the signal after it has been recorded into a device. So now we can draw representations of sound waves with different frequency and amplitude.
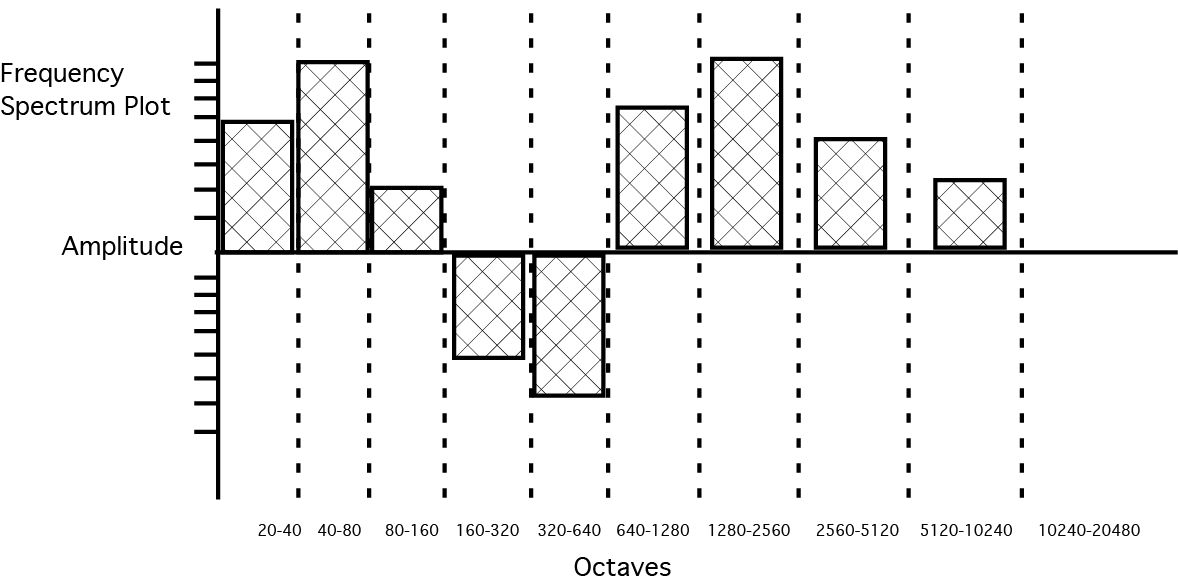
We can also represent all the frequencies and their levels that we can hear. The human ear can basically perceive a range from 20hz to 20k (kilo or thousand) hertz. This bandwidth is referred to the audible spectrum. Low frequencies are on the left, mid frequencies in the center, and high frequencies on the right. We divide up the audible spectrum into octaves, which are a doubling of a given frequency. The bands in the above plot show 20-40hz, 40-80hz, etc, dividing up the spectrum into 10 octaves.
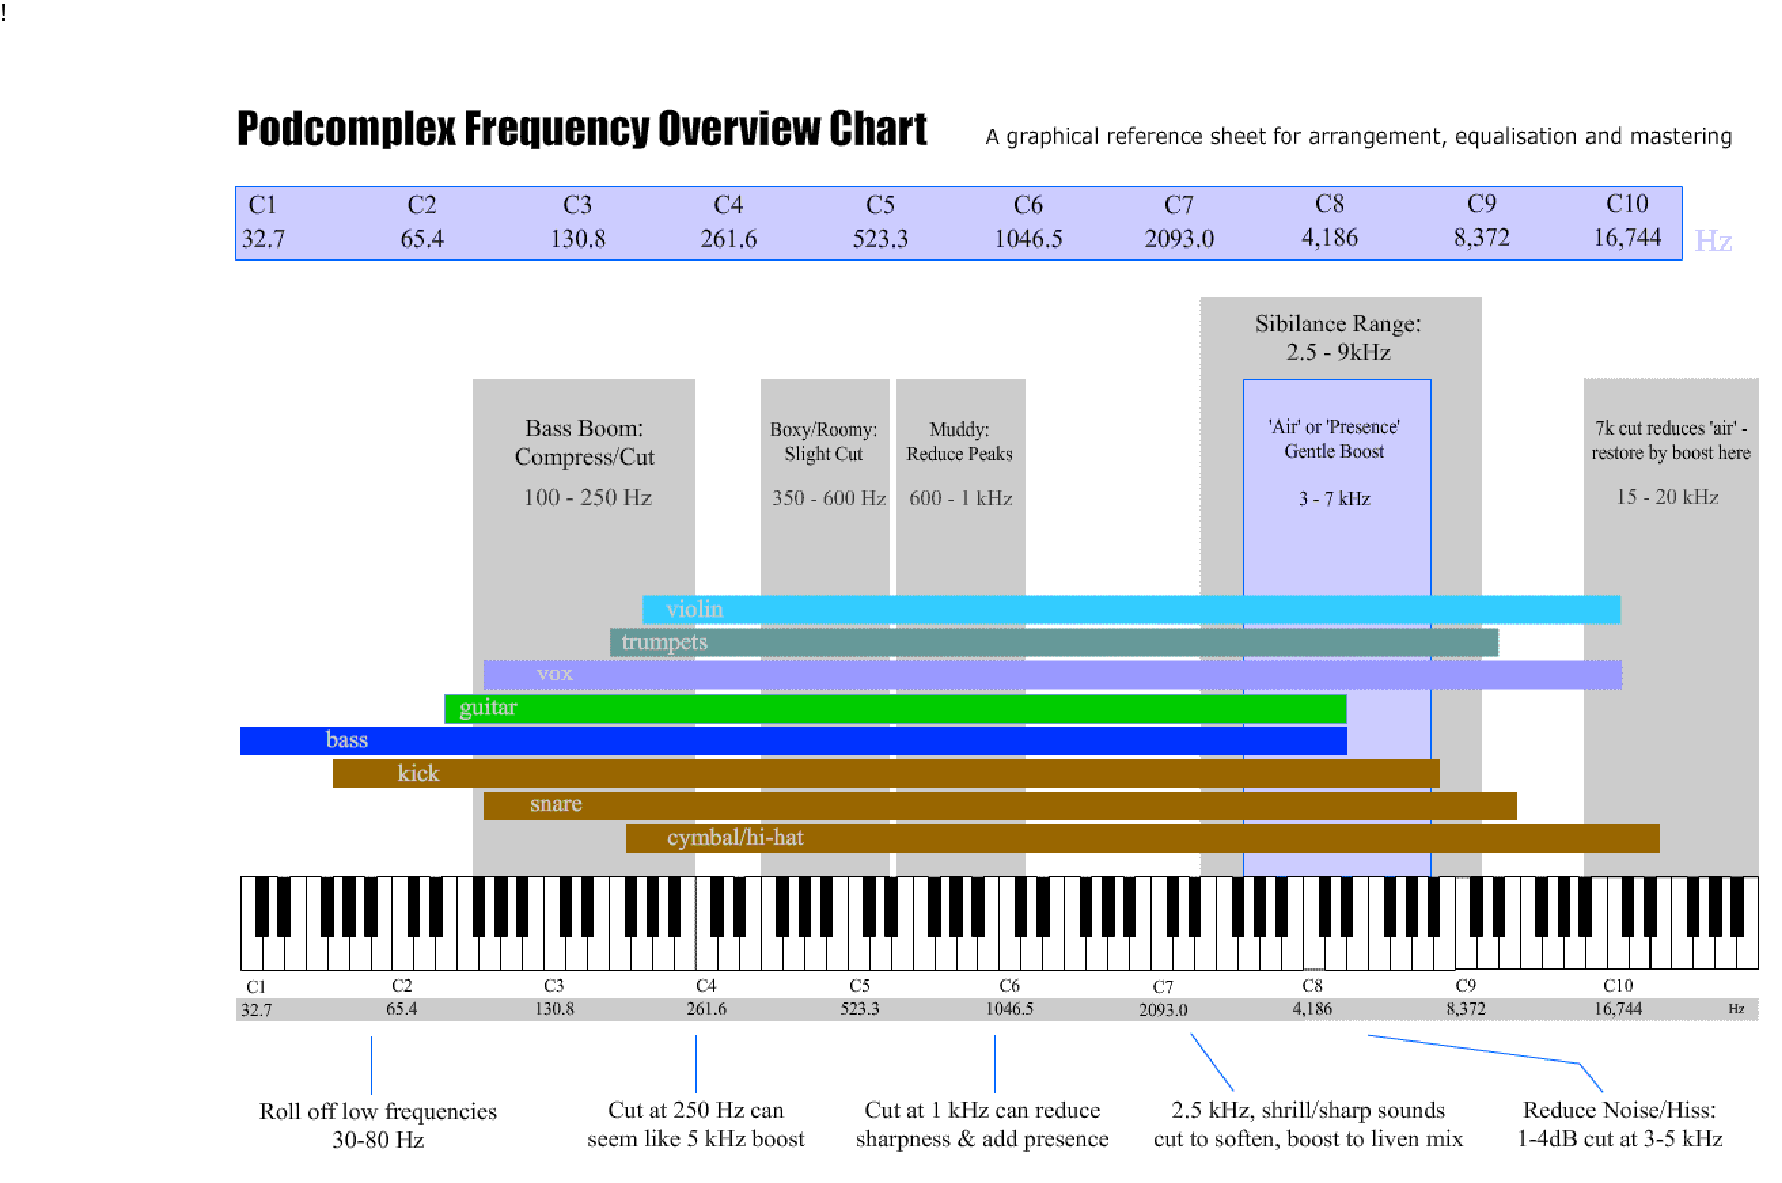
Another familiar reference to frequency is the piano, with it's range correlated to frequencies
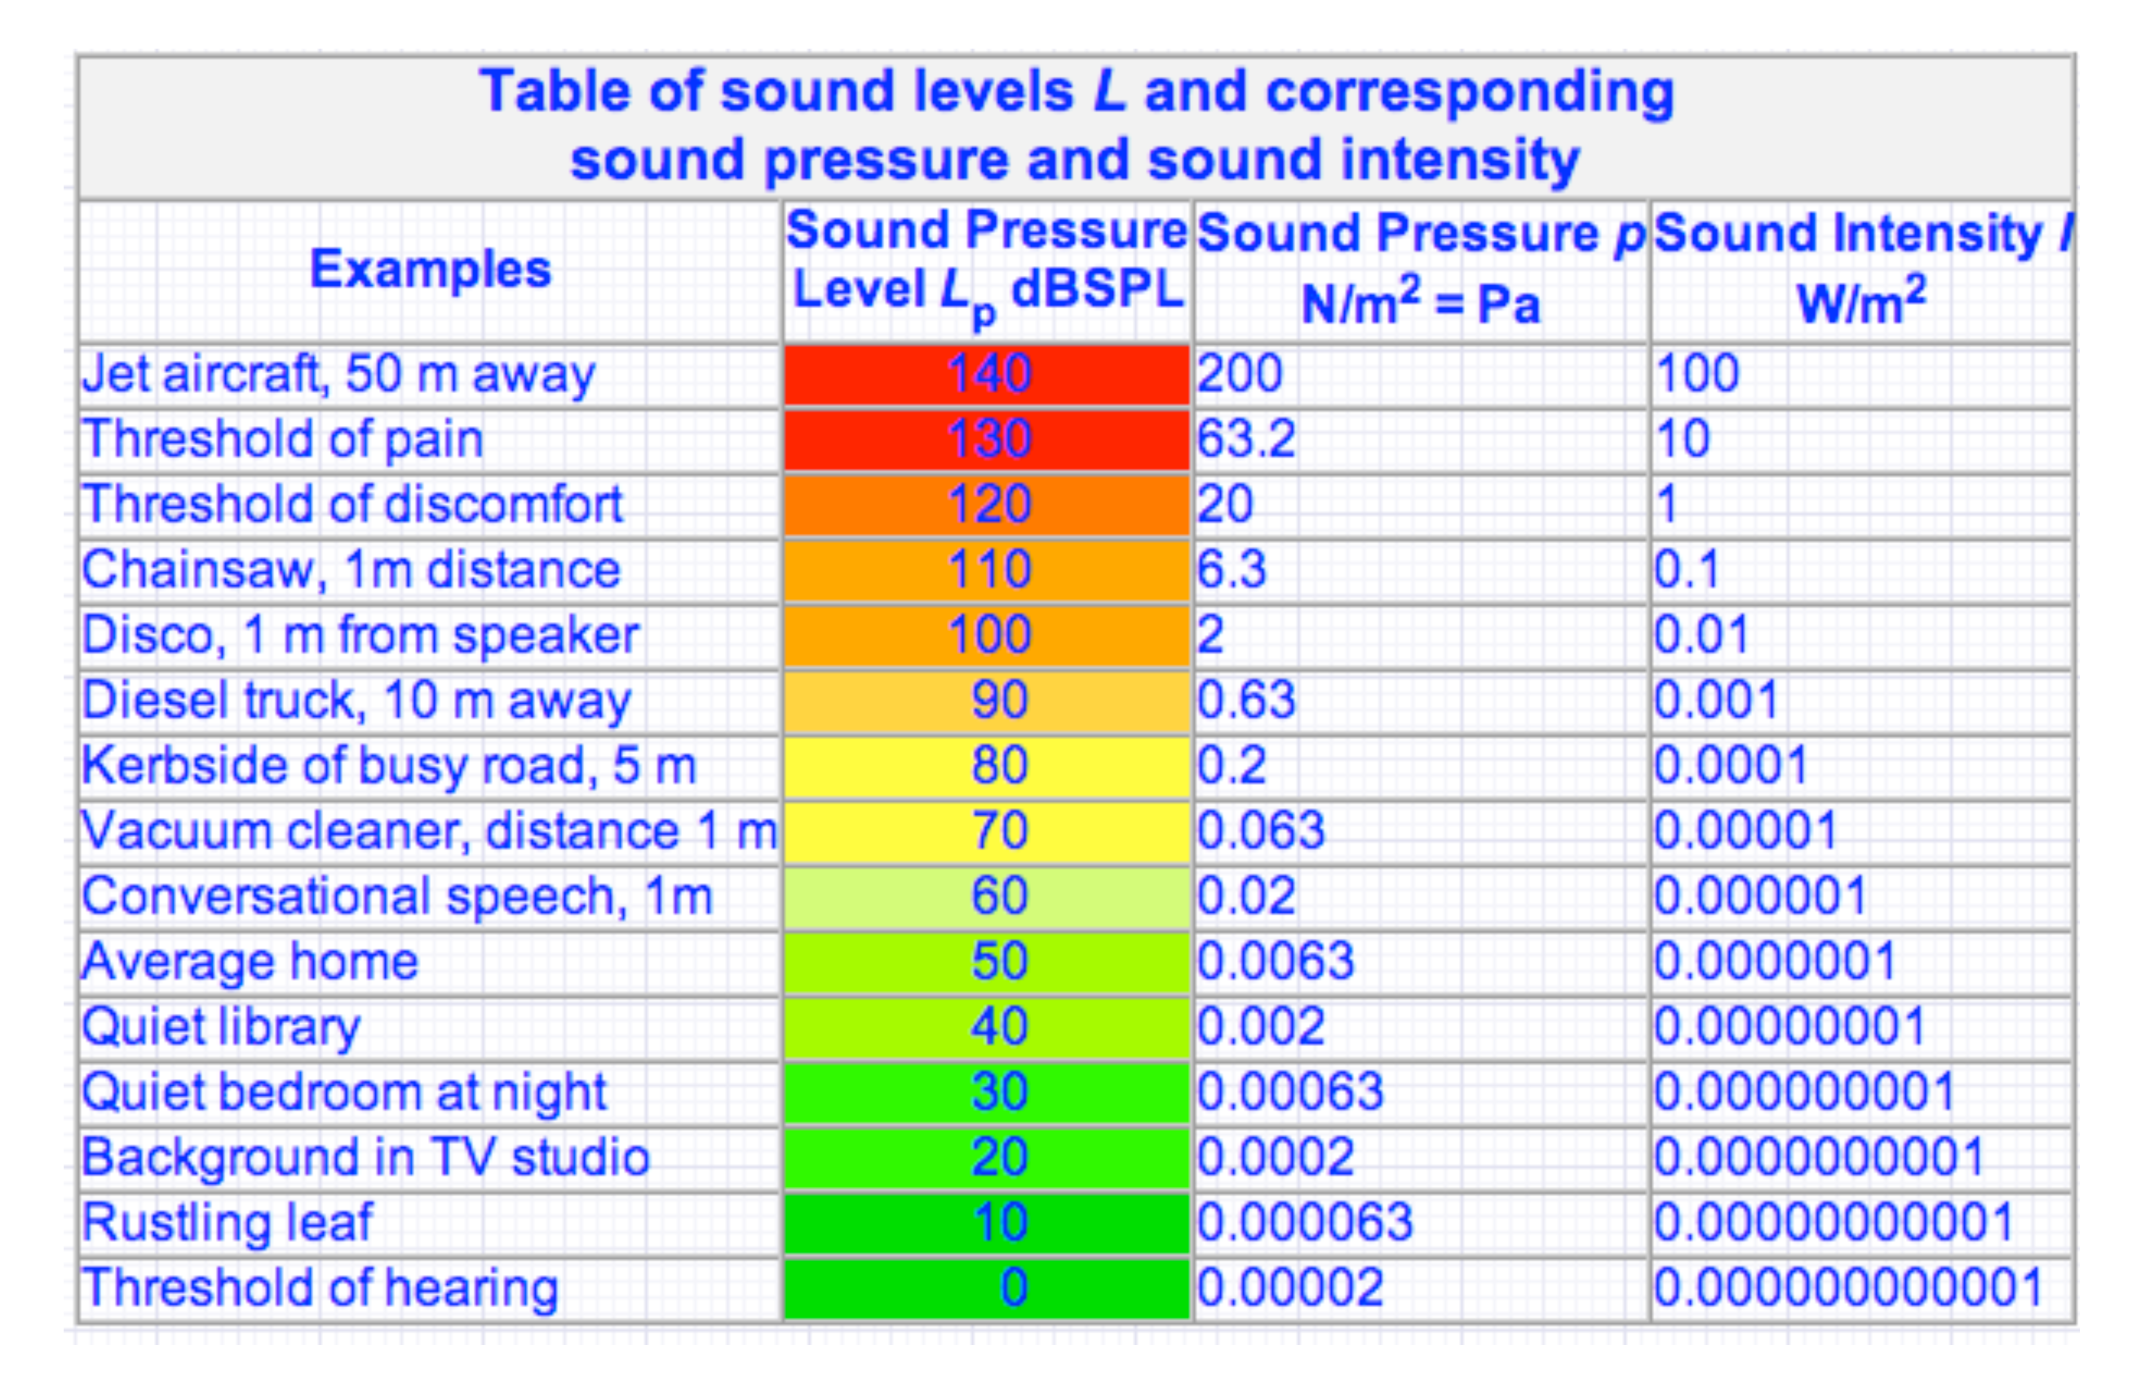
Loudness and Volume
We describe the amplitude of sound by how loud it is, and use the decibel as a unit of measurement to measure volume. Our ears are extremely sensitive, and have a huge range from quiet to loud that we can perceive. This decibel scale represents a ratio of amplitude of over a billion to one in terms of absolute pressure and is logarithmic. The decibel is used to measure sound pressure level (DBSPL) as well as electrical levels (DBV). The following chart shows the relationship between 0 db which is the quietest you can perceive, and the loudest sound you can be exposed to before your ears are pushed in