Difference between revisions of "Gephi"
From Help Wiki
(complex network analysis) |
(timeline) |
||
| Line 15: | Line 15: | ||
File:Gephi-preview3.png|Network visualization. | File:Gephi-preview3.png|Network visualization. | ||
File:Gephi-preview4.png|Complex network analysis. | File:Gephi-preview4.png|Complex network analysis. | ||
| − | </ | + | File:Gephi-timeline sparkline.png|Timeline. |
| + | </gallery> | ||
Revision as of 17:15, 21 November 2012
Description
Gephi is a tool for people that have to explore and understand graphs. Like Photoshop but for data, the user interacts with the representation, manipulate the structures, shapes and colors to reveal hidden properties. The goal is to help data analysts to make hypothesis, intuitively discover patterns, isolate structure singularities or faults during data sourcing. It is a complementary tool to traditional statistics, as visual thinking with interactive interfaces is now recognized to facilitate reasoning. This is a software for Exploratory Data Analysis, a paradigm appeared in the Visual Analytics field of research.
Links
User Interface
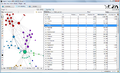
Data table user interface.
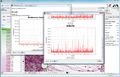
Result of data analysis.
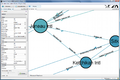
Network visualization.
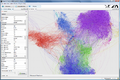
Complex network analysis.

Timeline.


